One of the keys to improving operational efficiency is productivity analysis: using data to objectively understand existing operations and finding ways to make improvements.
Managing worker, team and overall productivity in the warehouse and on the factory floor has historically been reliant on subjective observations by supervisors as there was no simple way to track time spent on tasks by individuals and groups. Time keeping systems have offered a partial solution, but they are time-consuming to use, are error prone, and often workers record estimates of time spent on tasks.
The Challenges with Time Tracking
- Many of the tasks performed are based on paper documents and verbal instructions. As such, their related activities are not recorded systematically.
- Warehouse and factory floor workers are under pressure to do their assigned tasks and logging task-time is something they don’t perceive as important. As a result, they tend to do logs based on what they remember at the end of the day or even several days after the time when work was performed.
- Timely recording of time spent on task is one more thing the worker is asked to do. Workers soon figure out what management’s expectations are for time tracking results and they ensure what they record is within those expectations no matter what actually happened.
Data: A Solution for Productivity Management
Objective data for productivity analysis requires that the recording of task data be a by-product of the work performed by operators in the warehouse and factory. It also requires that the system be a paperless one – any data management that still uses paper-based information that is captured later is inefficient by nature and is prone to inaccuracy.
Implementing warehouse management and manufacturing software systems designed for tracking material usage and actual labor, like TransLution™ Software, can reduce and even eliminate the paper instructions currently used, but most importantly they provide methodology that records accurate time spent on task as a byproduct of worker activities. This, in turn, provides data that can be used to present objective productivity results.
TransLution™ WMS software is structured to simplify logging of information as a part of the daily lives of workers. Worker instructions may be dispatched directly to their scanners and mobile devices as they perform their tasks. TransLution™ automatically records the date, time, worker, device used, and all other relevant data associated with each task, making productivity records a byproduct of performing these tasks. Tasks that are ordered verbally or are paper based are also recorded as and when the tasks are performed. Non-productive work such as breaks, lunch, meetings and standing time are recorded as each worker must account for their work as it happens every day.
The work records recorded are stored in the TransLution™ database as each scan and entry is recorded by the workers, providing the historical data required for objective analysis.
Visualization of Productivity Data
Visualizations of data can be a useful tool to give businesses a clear overview of operations and where improvements can be made.
The tools for these visualizations can include SSRS queries and reporting, BI tools available for use with MS-SQL, TransLution™ Query Tool that comes with TransLution™ Software, and even Excel templates with PIVOT tables designed to interact with the database directly to provide contrasting views.
The visualization examples shown below are aggregated based on data provided by a TransLution™ Software client. The manager of this entity reports that 60% of the value gained from TransLution™ is through the way recording activities have been simplified, streamlined, and integrated into their ERP software. The remaining 40% comes from what TransLution™ Software can tell them about their operations to help them continually improve and lower associated costs.
The Three Areas of Productivity Analysis
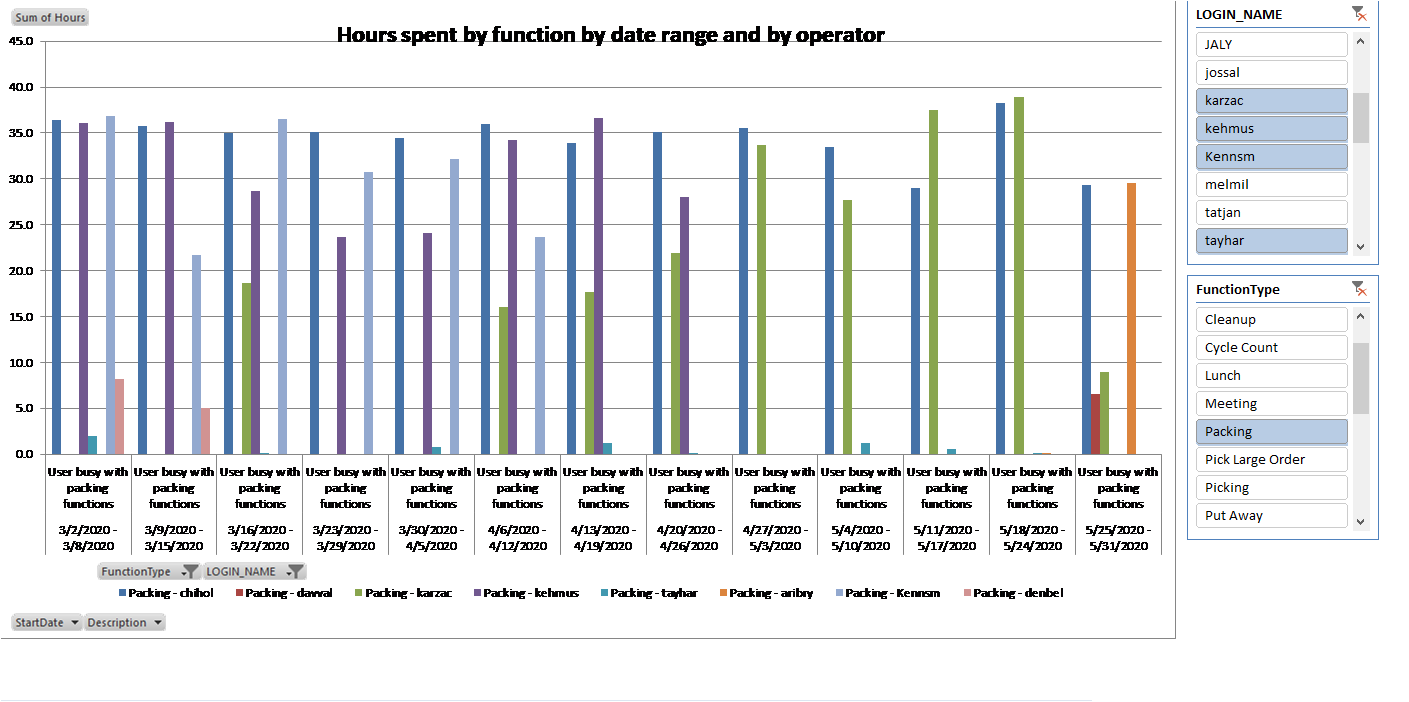
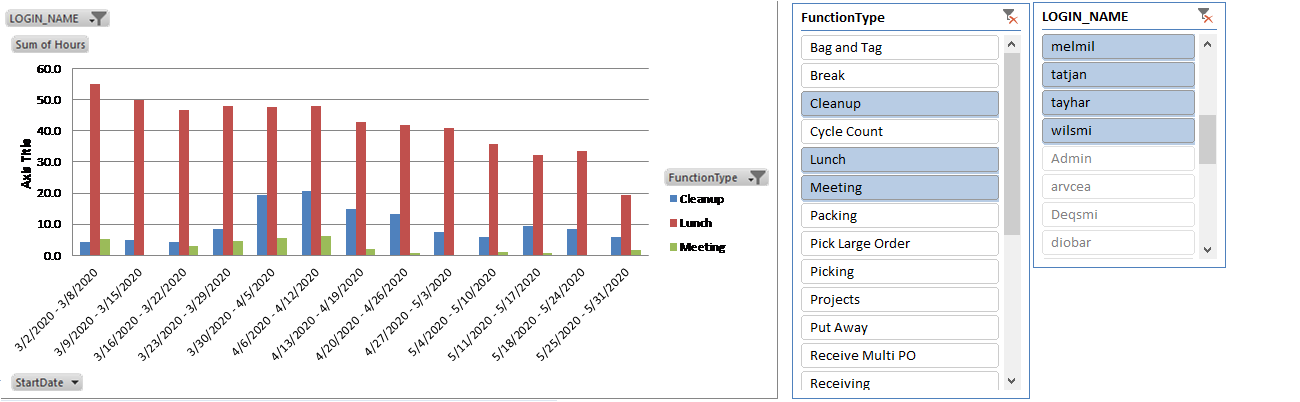
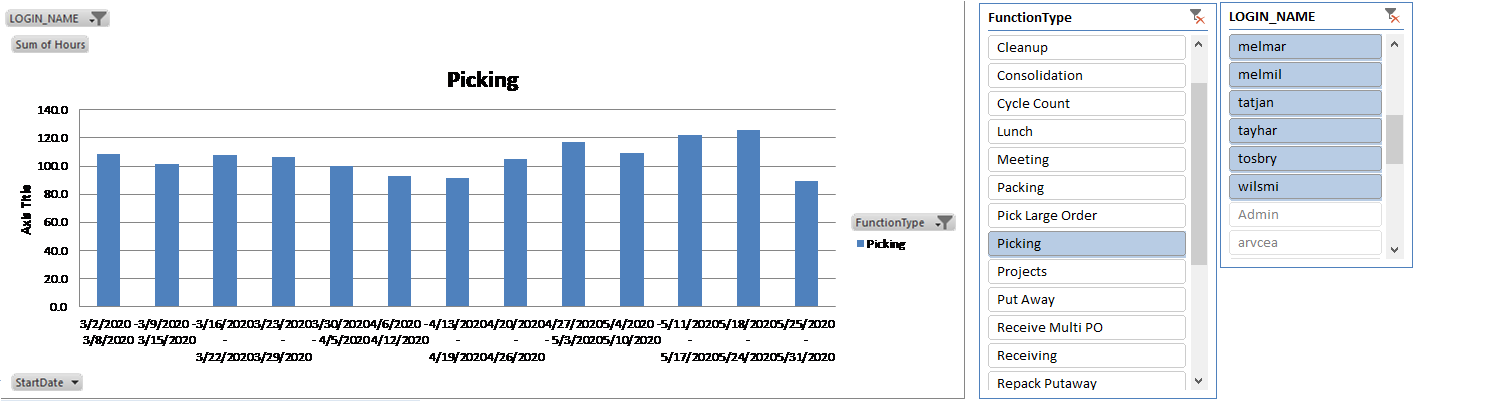
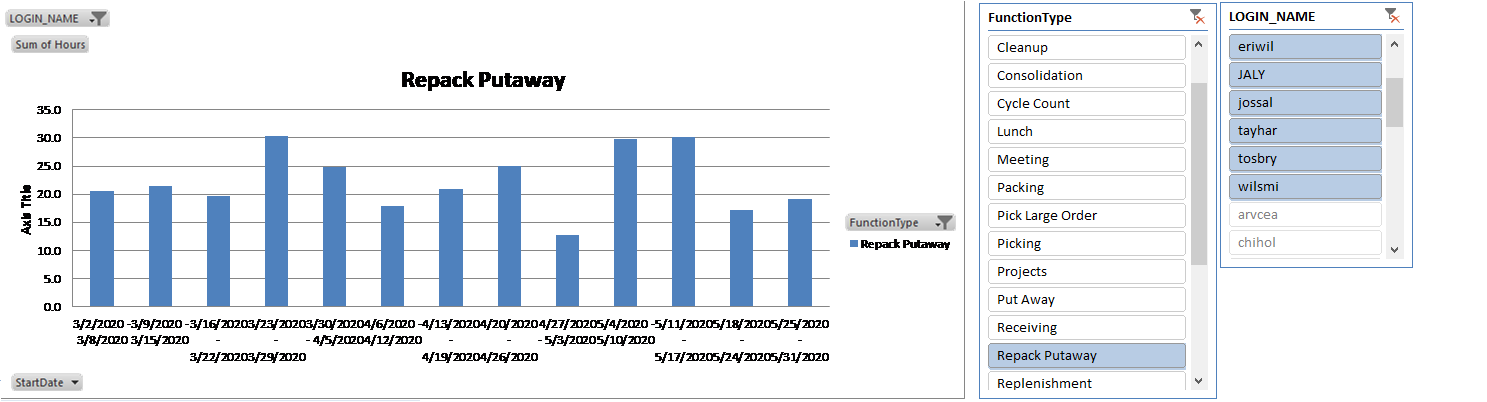
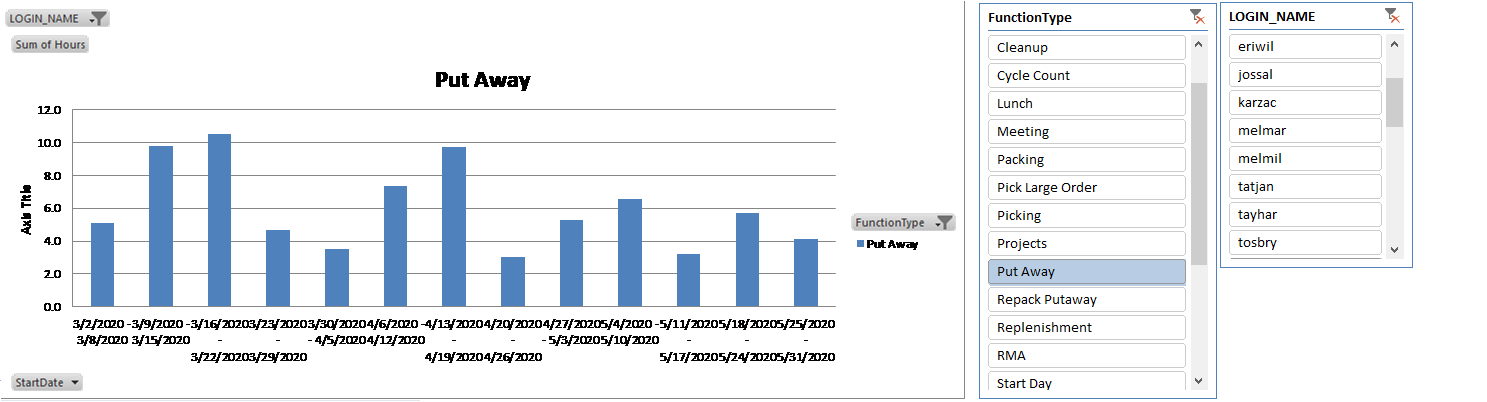
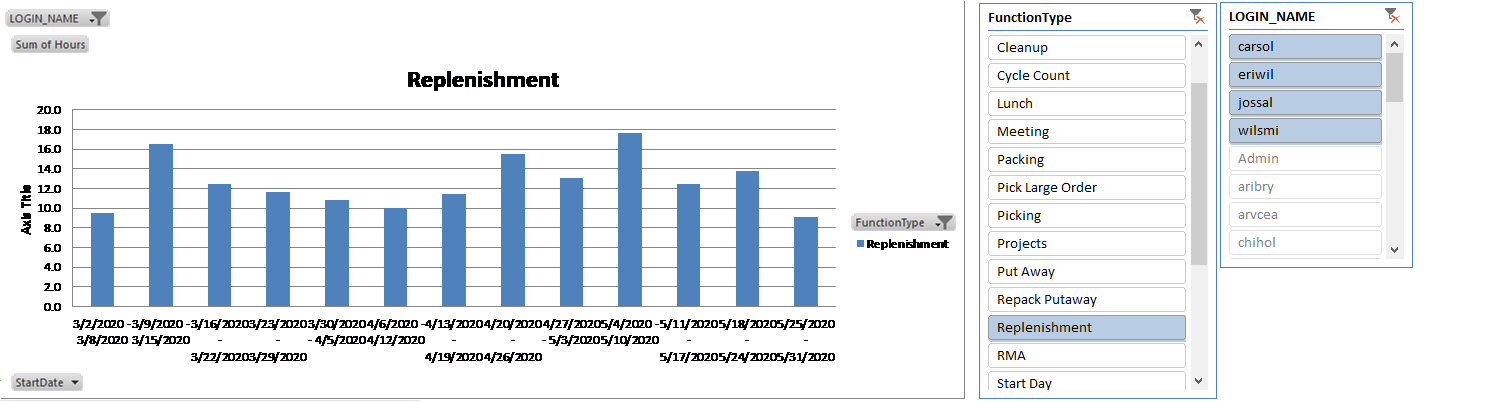
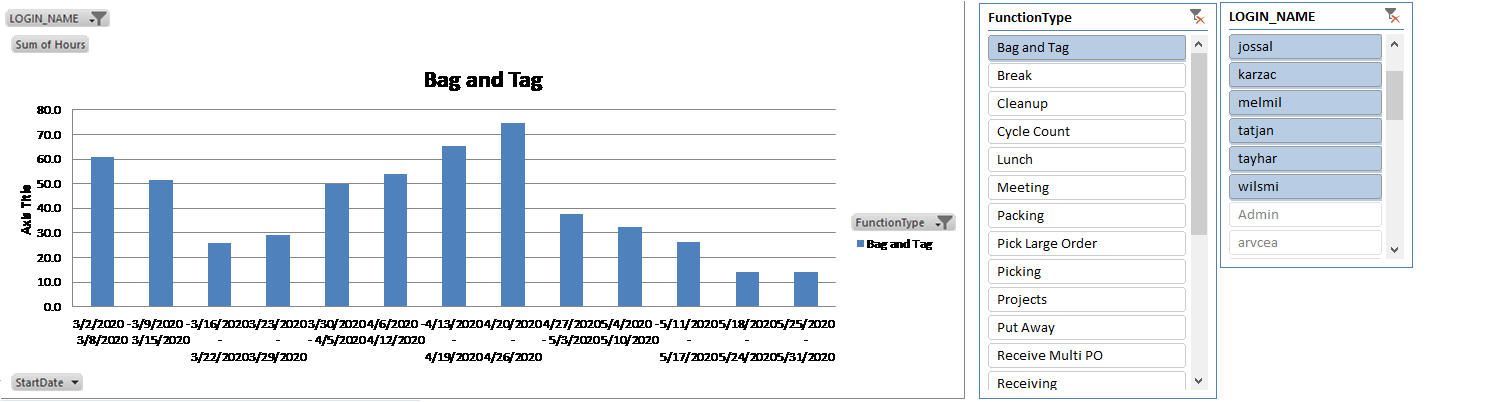
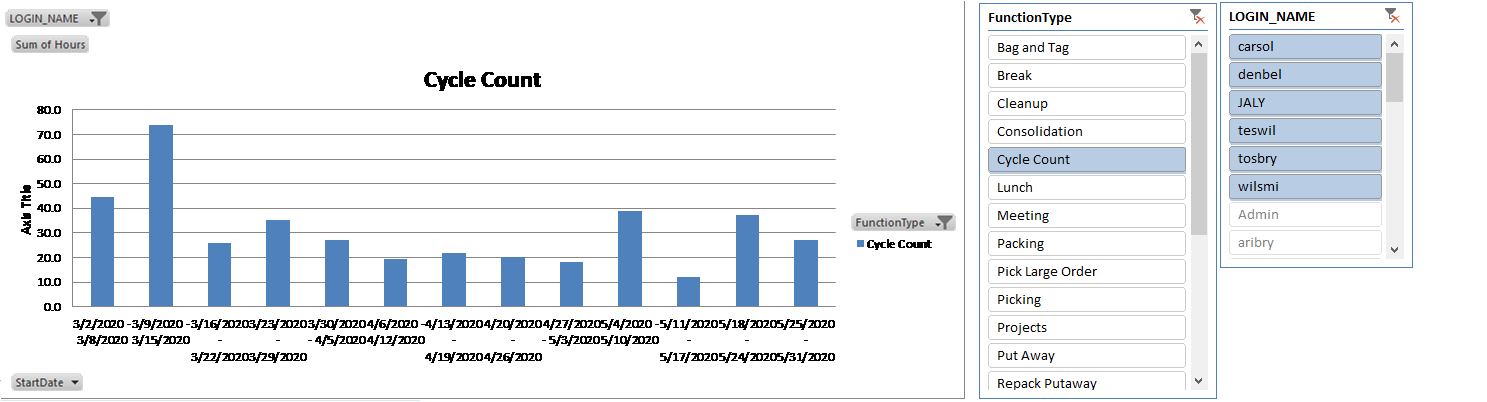
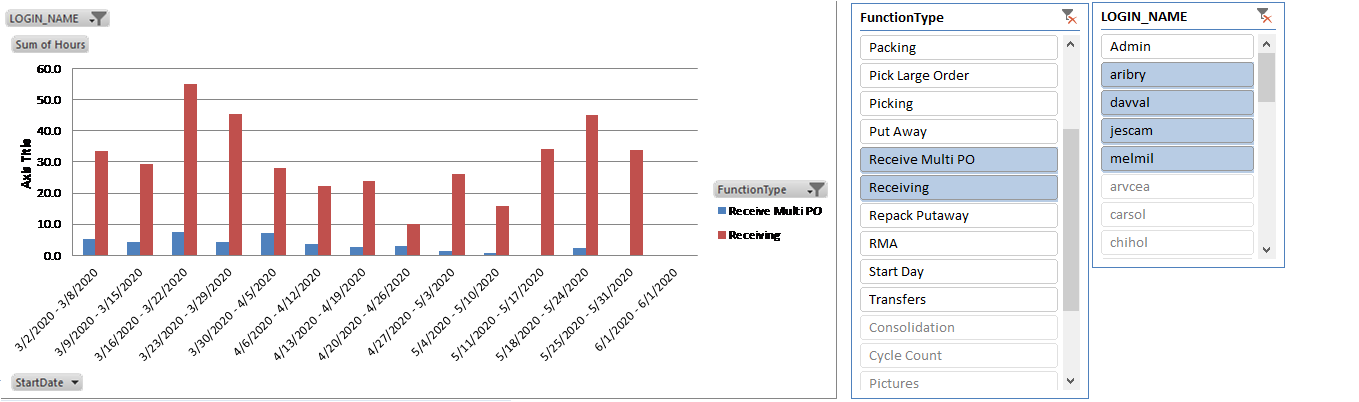
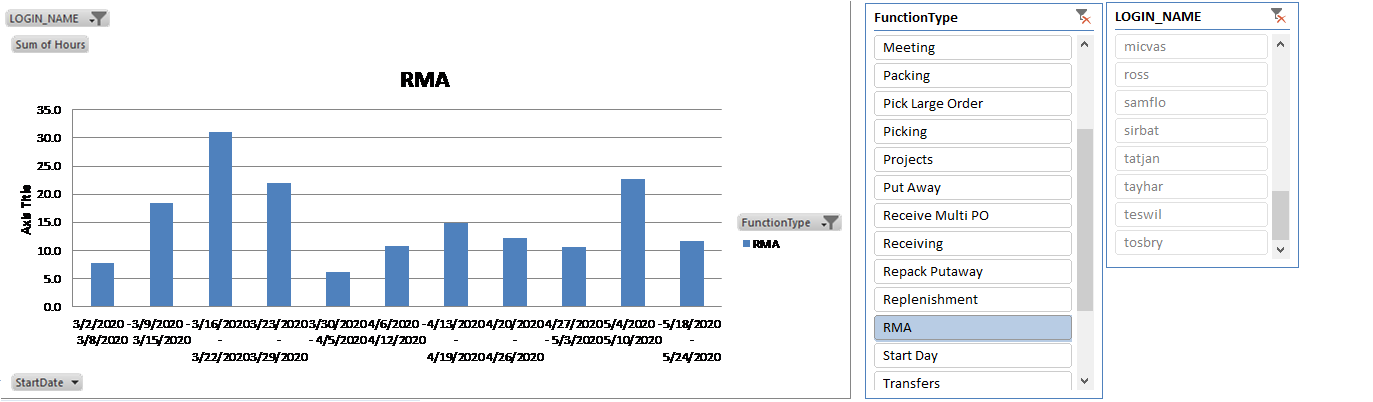
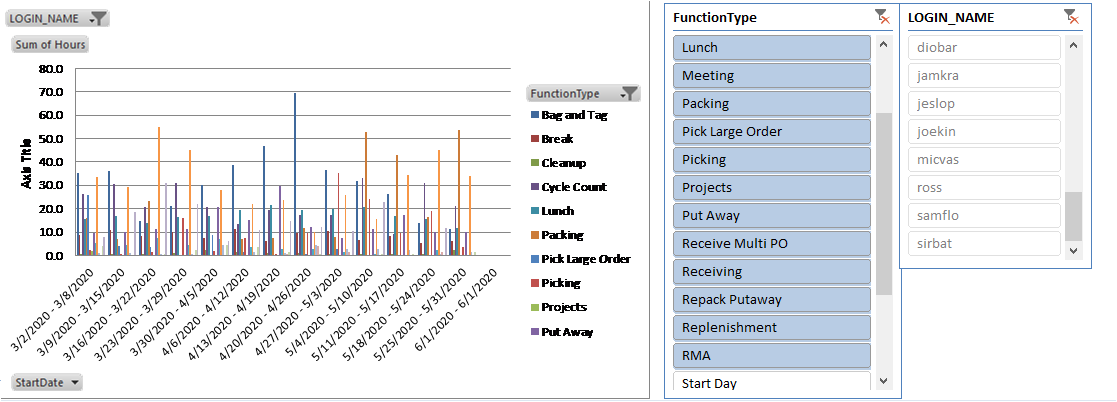
Analysis of productivity over time
Productivity over time relates to hours spent on tasks by individuals, groups of individuals and teams over time. This information reviewed by week, for example, results in an objective view of work performed that can be used for creation of performance targets for individuals and teams, and for discovering where bottlenecks and slack periods exist in the operation. Training or redeployment of people to tasks to which they are best suited is revealed in this analysis.
Analysis of real-time productivity
Because the task information is recorded in real time as tasks are performed, dashboard views showing the current state of work are also possible. For example, orders released to the warehouse that are in picking but are not complete, work performed today on production jobs, and so on.
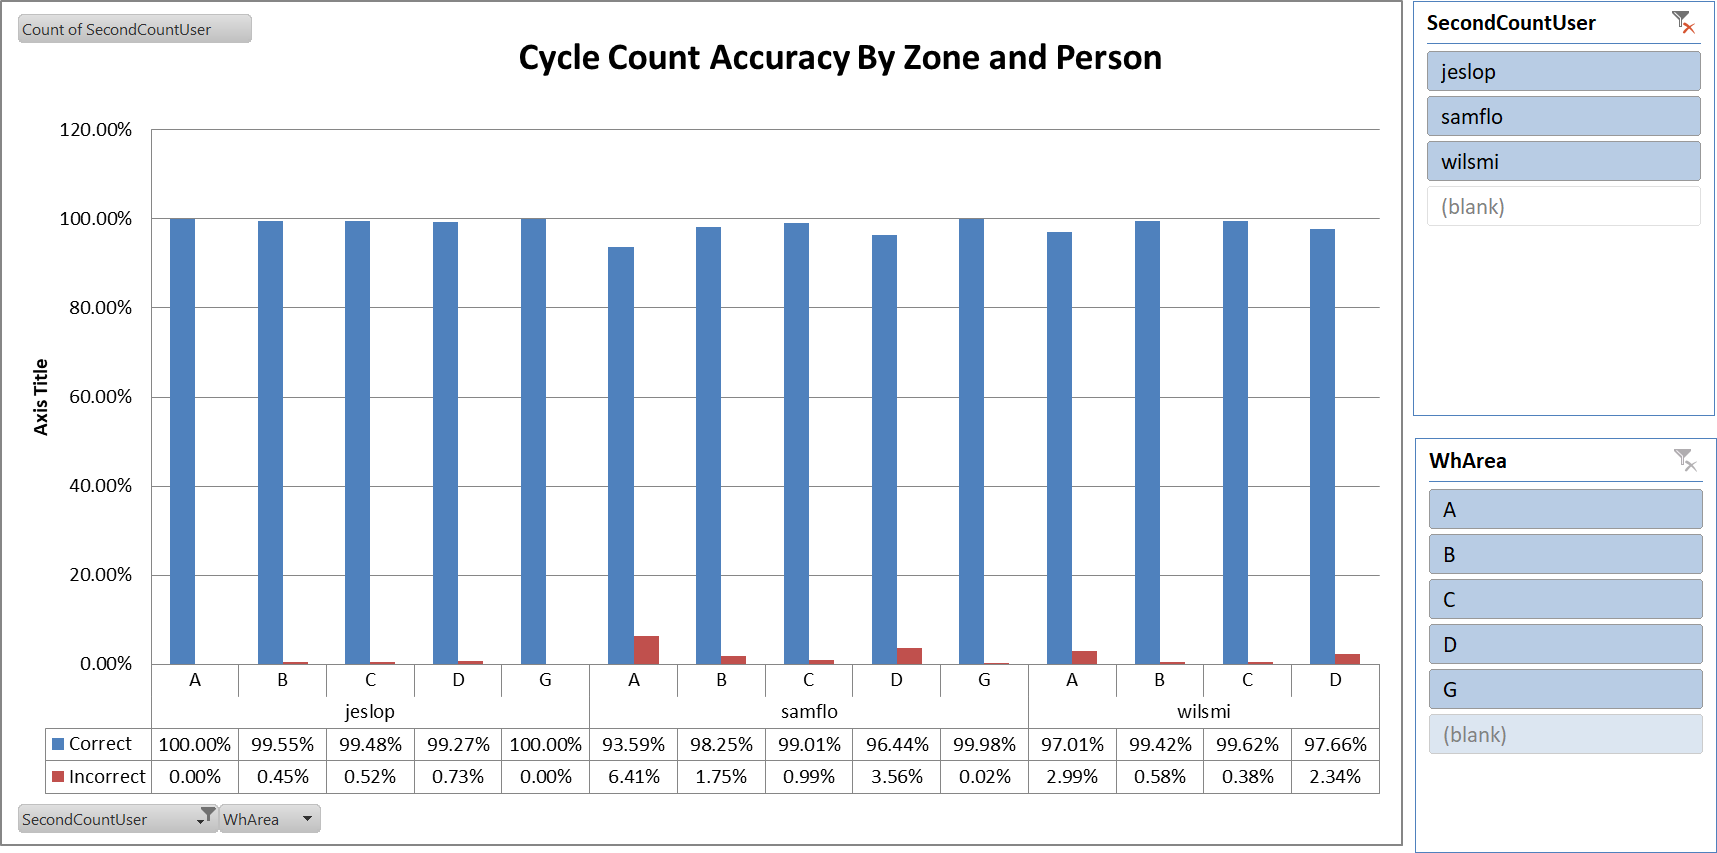
Analysis of quantity data
Information is also available to show quantities of work performed such as parcels packed, number of items picked, production and scrap quantities, and so on, which can provide a different understanding of work performed and loading of workers.