


Suzuki is cutting supplier production days so it can grow. The reason comes down to one distinction most production plans miss: planned capacity versus reliable capacity
In short: Planned capacity is what your production plan, spreadsheet or ERP says a line can produce. Reliable capacity is what the line can deliver given its maintenance, tooling, staffing, material and quality status right now. The distance between the two is the Gap. Suzuki is asking Indian suppliers to stop production one day a week for machine maintenance so their factories can hit higher volumes reliably as it scales toward 4 million vehicles a year.
Key takeaways
- Suzuki asked its Indian suppliers to move to 20 hours a day, six days a week by September 2027, with one full day for maintenance.
- A machine rated at 1,000 units and a line that can reliably produce 1,000 units are two different numbers.
- The Gap between what your systems believe and what is physically happening exists in capacity, not just inventory.
- Syspro can only record what the floor tells it. TransLution captures each step at the source, so Syspro stays current.
- Closing the Gap pays: A&A Electrical estimates up to £200K a year, Skillcraft took stock accuracy from 68% to 97%, and LANCEWOOD cut plan updates from three to five days to three hours.
- The Big Five of Operational Truth turn capacity from a static number into an operating decision.
- Predictability = Visibility + Control. Seeing a problem only helps if you see it soon enough to act.
Table of contents
- Why did Suzuki ask its suppliers to produce less?
- What is the difference between planned capacity and reliable capacity?
- Why doesn’t the factory run at theoretical capacity?
- How did LANCEWOOD close the Gap?
- How do the Big Five of Operational Truth apply to capacity?
- What does the Gap look like in a production meeting?
- Why isn’t visibility enough on its own?
- Why does growth make the Gap wider?
- What can SYSPRO not see on its own?
- How do you find the Gap on one production line?
- Frequently asked questions
Why did Suzuki ask its suppliers to produce less?
Suzuki asked its Indian suppliers to stop production one day a week for machine maintenance because it needs them to produce more, reliably, as Maruti Suzuki scales from about 2.4 million to 4 million vehicles a year by 2030. According to Reuters, it is the first time Suzuki has issued such a directive to its Indian suppliers, and the goal is to prevent unscheduled stoppages and maintain quality ahead of the ramp.
The details are specific:
- The schedule. Suppliers are to move to 20 hours a day, six days a week by September 2027, giving machines four hours of downtime each night and a full day for maintenance.
- The commitment. Reuters reported that Suzuki president Toshihiro Suzuki met suppliers in August, and that suppliers have been asked to sign declarations by year end confirming their lines for the automaker do not run all seven days.
- The concern. Suzuki worries that nonstop schedules raise the risk of accidents, surprise breakdowns and quality problems just as suppliers take on more volume and more complex technology.
- The trade off. Suppliers may need to invest in plants and machinery to make up for rested lines.
At first the logic sounds backward: stopping production in order to produce more. The difference between planned capacity and reliable capacity explains it, and manufacturers that confuse the two often discover the difference at exactly the wrong time.
On a stamping line, four hours of nightly downtime is the window in which a technician can check die wear, re-torque the fixings and pull vibration readings before the day shift loads the first coil. A line that never stops never gets that window, and a worn die tends to announce itself as scrap or a stoppage.
What is the difference between planned capacity and reliable capacity?
Planned capacity is what a system says a machine or line can produce. Reliable capacity is what the operation can actually deliver given everything that is true on the floor right now.
The ERP says the machine is rated at 1,000 units. The spreadsheet shows 1,000 units available and the weekly plan assumes 1,000. The factory may know something different:
- The machine requires maintenance.
- A tool needs replacing.
- Changeover is taking longer.
- A quality issue is reducing yield.
- The right operator is not available.
- Material is not staged.
- A downstream machine is already constrained.
Rated output is a property of the machine. Reliable output is a property of the whole operation around it.
| Planned capacity | Reliable capacity | |
| Where it lives | ERP, spreadsheet, production plan | The floor |
| What it assumes | Rated speed, full availability, staged material | Current maintenance, tooling, staffing, material and quality status |
| When it was true | When the plan was created | Right now |
| What it answers | The hours a line should produce | The hours a line can reliably produce |
That difference is another version of something we talk about frequently at TransLution: the Gap, the distance between what your systems believe and what is physically happening. It shows up in capacity as well as inventory.
Why doesn’t the factory run at theoretical capacity?
Because the operation changes faster than the information supporting the plan. Most production plans begin with assumptions. This machine can produce X. This line can run Y hours. This material will arrive on Tuesday. This order requires Z hours.
Those assumptions may have been accurate when the plan was created. Then a machine slows, material arrives late, quality puts product on hold, an urgent order gets inserted and maintenance gets deferred. One assumption changes, then another, and eventually the plan and the physical operation are telling two different stories.
The problem is not that the plan was wrong. The problem is that nobody could see it becoming wrong.
How did LANCEWOOD close the Gap?
LANCEWOOD cut the time to update its production plan from three to five days to about three hours by connecting live floor data to the spreadsheet and Syspro it already used. LANCEWOOD is one of South Africa’s largest cheese and dairy producers, and it was growing fast.
Before TransLution, floor data was captured on paper, retyped into Excel and keyed into Syspro by hand, a process that often put production as much as two days behind schedule (LANCEWOOD case study).
In a high-volume operation producing perishable product, pallets were moving to curing facilities and orders were changing while the planning figures sat days behind. By the time the plan reflected the factory, the factory had moved again.
| Before TransLution | After TransLution | |
| How floor data reached SYSPRO | Paper, then Excel, then manual entry | Scanned at the point of activity and posted to SYSPRO |
| Planning tool | Excel, updated by hand | The same Excel sheet, filled automatically from live data |
| Time to update the plan | Three to five days | About three hours |
| Planner confidence | Figures were days old | Figures were accurate and current |
LANCEWOOD kept Syspro, the planning spreadsheet and the way its people already worked. The change was underneath them: physical movements were scanned, those transactions updated Syspro, and the planning spreadsheet pulled current figures from the same database. Pallets moving offsite for curing were tracked through Syspro’s Goods in Transit functionality.
The more important outcome was trust. For the first time, LANCEWOOD’s planners could rely on the numbers in front of them. See more results on our Syspro integration page and in our case studies.
How do the Big Five of Operational Truth apply to capacity?
The Big Five of Operational Truth are five questions that test whether your systems match physical reality, and they work for capacity exactly as they work for inventory. A number in a system is useful. A number that reflects what is physically happening now is much more useful.
| Question | For inventory | For capacity |
| 1. What do you have? | Actual usable stock | Actual usable production capability today, rather than the theoretical maximum or last month’s spreadsheet assumption |
| 2. Where is it? | Which warehouse, bin, pallet | Which plant, line, machine, shift and workstation. You can have enormous total capacity and still be constrained exactly where the next order needs to run |
| 3. Who is using it? | Which orders have allocated it | Which orders already consume the hours, which customers have priority, which runs need the same machine, which changeovers are scheduled |
| 4. Is it where you thought it would be? | Whether the bin matches Syspro | Whether maintenance is current, quality stable, tooling ready, material staged, the operator available, and the downstream process able to accept the output |
| 5. What is it costing you? | Carrying cost, stockouts, write offs | Unplanned downtime, overtime, deferred maintenance, scrap, missed shipments, emergency changeovers |
Question four is the Suzuki question. The plan says the machine is available; the floor may say its preventive maintenance is four hours overdue. The production plan describes an expectation, and Operational Truth tells you whether that expectation is still valid.
Question five is where the conversation becomes economic. The cost that matters most may be the one hidden in continuous running: a machine run flat out today can be less reliable tomorrow. Suzuki appears to have decided that one planned day of downtime is better than unpredictable downtime during production. That is not lost capacity. It is capacity protection.
The economics show up in warehouses too: A&A Electrical estimates that closing the Gap between its floor and Syspro is worth up to £200,000 a year.
What does the Gap look like in a production meeting?
In a production meeting, the Gap shows up as a schedule that looks fine on screen and falls apart the moment operations speaks.
Imagine the weekly meeting. Excel says Line 3 has 80 available hours, Syspro holds the production orders and the schedule allocates 76 hours. Then operations reports what the systems do not know: preventive maintenance is four hours overdue, one tool is nearing replacement, the night shift is short an operator, Tuesday’s material is not at the line and quality is still investigating yesterday’s scrap.
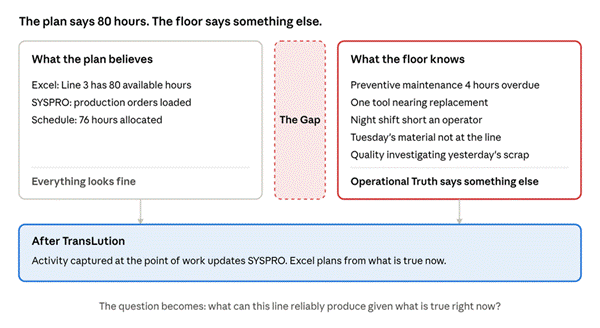
The weekly production meeting, before and after TransLution
After TransLution, production activity is captured closer to where it happens. Material movements are current, machine events and quality status are visible, and operators record activity at the point of work. Syspro receives current operational information, and Excel can still model the schedule, but the assumptions underneath it now match what is actually happening.
The meeting stops asking what the line should produce and starts asking what it can reliably produce given what is true right now. That is a better production decision.
Why isn’t visibility enough on its own?
Visibility only helps if it arrives early enough to act, which is why TransLution defines predictability as Predictability = Visibility + Control. Knowing a machine is becoming unreliable is useful. Discovering it after the machine stops means visibility arrives too late. The objective is enough warning to keep control.
| Visibility tells you | Control lets you |
| The maintenance window is approaching | Schedule maintenance |
| The material is not staged | Move material or change the sequence |
| The quality trend is deteriorating | Replace tooling or move production |
| The available hours have changed | Add a shift, reallocate capacity or change the customer commitment |
The value is in knowing soon enough to change what happens next.
Why does growth make the Gap wider?
Growth widens the Gap because every new order, shift, machine and supplier adds another assumption the plan has to get right. Growth brings more orders, more shifts and higher equipment utilization. It also brings pressure to defer maintenance and to trust the number on the screen and keep moving.
LANCEWOOD faced the same challenge while it was growing. The operation began moving faster than the information supporting it. Growth exposes weak information systems, because yesterday’s workaround eventually becomes tomorrow’s constraint.
The question to ask is how much capacity the plant can rely on, and what happens economically if the plan’s assumptions about it are wrong. That turns capacity from a static number into an operating decision.
What can SYSPRO not see on its own?
Syspro is a strong system of record, but it can only record what the floor tells it, and only when the floor tells it. If a pick is written on paper or a timecard is filled in at the end of the week, the ledger learns about it late or not at all.
TransLution sits on the floor, captures each step as it happens and posts it to Syspro, so the system keeps up with the people doing the work. In every example below, Syspro stayed exactly where it was.
| Customer | What Syspro could not see on its own | What TransLution captured | What closing the Gap was worth |
| A&A Electrical, UK electrical distributor, part of the Dewhurst Group | Who picked an order, when it finished and where it was stuck. Stock was counted once a year | Every pick, pack, label and daily cycle count, scanned live into Syspro | Up to £200K a year in estimated savings, about 88% less stock loss, £50K a year on shipping labels alone, and the stock take cut from 20 people for a full Saturday to 6 people for half a day |
| Skillcraft, industrial tools distributor, South Africa | Whether a stock record was right. Accuracy averaged 68% | Transfers, picking, checking and the full repairs process on barcode scanners, updating Syspro in real time | Stock accuracy from 68% to 97%, order lines from 900 to 2,200 a day, half the time to get an order to a customer, and repairs lead time 25 to 30% shorter |
| LANCEWOOD, cheese and dairy, South Africa | What happened on the floor in the last two days | Each production area captured at the source, one area at a time | Plan updates from three to five days to three hours, up to 93% less time on every update |
| St Leger & Viney, decorative fabrics, South Africa | The dye batch, bin and true remaining length of every roll | Batch numbered labels at receiving, rolls scanned to bins, real cut lengths posted | Stock take from at least three days to less than one, with a daily variance report |
| Airborne Systems, parachutes for the U.S. Department of Defense and allies | Actual labor, known only after paper timecards were retyped | Labor captured on rugged tablets at the workstation | 280 people off paper timecards and manual labor entry by finance eliminated |
Across the five companies the pattern is consistent: the Gap shows up as labor spent counting and retyping, stock written off, orders promised on stock that is not there, and plans built on last week’s floor. Each kept Syspro and stopped paying for the Gap. As Skillcraft put it: “All together, we halved the time to get an order to a customer.”
The same logic applies to capacity: the hours Suzuki is protecting with a planned maintenance day are only valuable if the plan knows they are real. TransLution has helped more than 300 clients since 2002. Read the full stories in our case studies.
How do you find the Gap on one production line?
Pick one important production line and answer the Big Five for it.
- What do you have? The reliable capacity on the line, in hours or units.
- Where is it? Which machine, shift and process holds it.
- Who is using it? Which orders consume it.
- Is it where you thought it would be? Whether physical reality still matches the plan.
- What is it costing you? What downtime, overtime, maintenance, scrap and lost throughput actually cost.
If those five answers are immediate and trustworthy, you have a strong operating foundation. If answering them takes three spreadsheets, four phone calls and someone walking onto the floor to see whether the machine is running, you may have found the Gap.
Suzuki is deliberately stopping production one day a week because it wants more reliable production the other six. That is the paradox. Sometimes the fastest way to produce more tomorrow is to stop pretending every available hour today is usable capacity.
The production plan tells you what should be possible. Operational Truth tells you what you can actually rely on.
How many of the hours on this week’s plan could you vouch for today?
Walk the floor with us. Give us an hour on your floor. We will follow one order from receiving to dispatch, show you exactly where the Gap is hiding, and put a number on what closing it is worth. See how TransLution connects the floor to Syspro on our Syspro integration page, or read how A&A Electrical, Skillcraft, LANCEWOOD, St Leger & Viney and Airborne Systems closed the Gap in our case studies.
Your floor. Your facts. Right now.
Frequently asked questions
Suzuki asked its Indian suppliers to halt production one day a week for machine maintenance to prevent unscheduled stoppages and protect quality as Maruti Suzuki scales from about 2.4 million to 4 million vehicles a year by 2030. Suppliers are expected to move to 20 hours a day, six days a week by September 2027.
Planned capacity is what an ERP, spreadsheet or production plan says a machine or line can produce. Reliable capacity is what the operation can actually deliver given its current maintenance, tooling, staffing, material and quality status.
The Gap is the distance between what your systems believe and what is physically happening on the floor. It appears in inventory, when stock records do not match the shelf, and in capacity, when the plan assumes hours a line cannot reliably deliver.
The Big Five of Operational Truth are what you have, where it is, who is using it, whether it is where you thought it would be, and what it is costing you. If a manufacturer cannot answer them quickly and confidently, it likely has an operational problem rather than a reporting problem.
It means a manufacturer can only predict outcomes when it sees what is happening early enough and has the ability to act on it. Visibility without time to act only explains what went wrong after the fact.
LANCEWOOD used TransLution to scan physical movements on the floor, post those transactions to SYSPRO and feed current figures into its existing Excel planning sheet. Updating the production plan went from three to five days to about three hours.
No. TransLution captures activity at the point of work and posts it to SYSPRO, so SYSPRO and the spreadsheets planners already use run on current information instead of data that is days old.
A&A Electrical estimates up to £200K a year in savings and cut stock loss by about 88%. Skillcraft raised stock accuracy from 68% to 97% and order lines from 900 to 2,200 a day. LANCEWOOD cut plan updates from three to five days to three hours. St Leger & Viney cut its stock take from at least three days to under one, and Airborne Systems took 280 people off paper time cards. Each kept SYSPRO in place.
Sources
- Reuters via Business Standard, Suzuki Asks India Suppliers to Shorten Production Week in Push for Quality, October 2, 2026
- Finimize, Suzuki Wants Indian Suppliers to Take a Weekly Day Off, October 2026
- Hello Entrepreneurs, Suzuki Tells Indian Suppliers to Take a Day Off Every Week, October 2026
- TransLution Software, Case Study: LANCEWOOD Automates Production Processes
- TransLution Software, Case Studies: A&A Electrical (2026), Skillcraft (2023), St Leger & Viney and Airborne Systems. Savings figures are A&A Electrical’s own estimates
- TransLution Software, SYSPRO Integration
