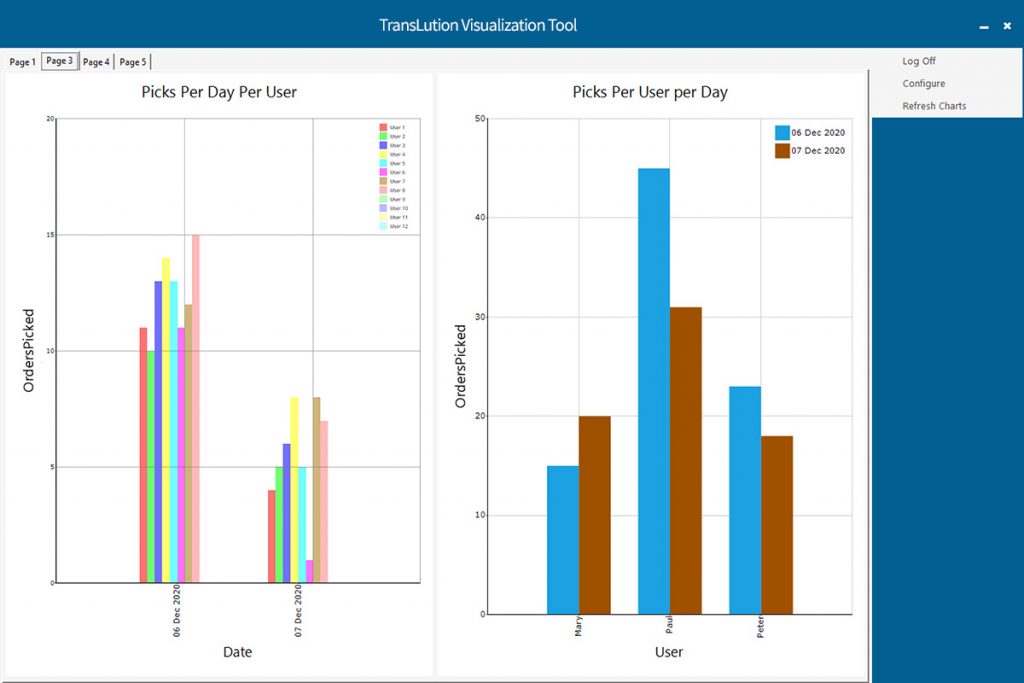

TransLution is excited to announce the official release of our new Visualization Tool. Designed to present the extensive operational data that is already captured by TransLution™, the Visualization tool provides configurable charts and graphs that can be used to analyze and improve business processes.
Made easily available from within the TransLution™ interface, these visual tools allow managers to analyze data in real time, and quickly and effectively adapt workflows and processes to address issues.
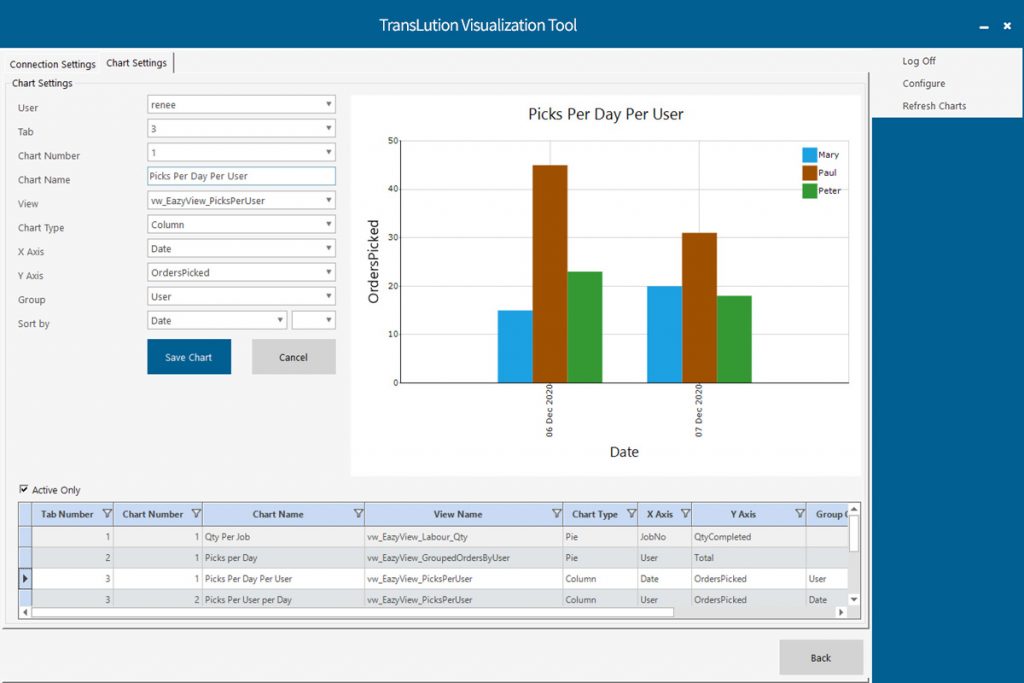
The nature of the deep level of information tracked and stored by Translution™ means that the Visualization tool can be used to monitor key performance indicators across almost any area of operations.
| Cookie | Duration | Description |
|---|---|---|
| cookielawinfo-checkbox-analytics | 11 months | This cookie is set by GDPR Cookie Consent plugin. The cookie is used to store the user consent for the cookies in the category "Analytics". |
| cookielawinfo-checkbox-functional | 11 months | The cookie is set by GDPR cookie consent to record the user consent for the cookies in the category "Functional". |
| cookielawinfo-checkbox-necessary | 11 months | This cookie is set by GDPR Cookie Consent plugin. The cookies is used to store the user consent for the cookies in the category "Necessary". |
| cookielawinfo-checkbox-others | 11 months | This cookie is set by GDPR Cookie Consent plugin. The cookie is used to store the user consent for the cookies in the category "Other. |
| cookielawinfo-checkbox-performance | 11 months | This cookie is set by GDPR Cookie Consent plugin. The cookie is used to store the user consent for the cookies in the category "Performance". |
| viewed_cookie_policy | 11 months | The cookie is set by the GDPR Cookie Consent plugin and is used to store whether or not user has consented to the use of cookies. It does not store any personal data. |